Linear Regression for High School Students: Your Step-by-Step Guide
- Piyush Shah
- 5 days ago
- 4 min read


Have you ever noticed that people who practice more usually get better results? That idea is at the core of linear regression, a simple way to find a straight-line connection between two things. In this post, I’ll walk you through what linear regression is, how to work it out by hand, and why it matters. Along the way, I’ll share how I’ve used real student projects to make the math click.
What Is Linear Regression?
The Big Picture
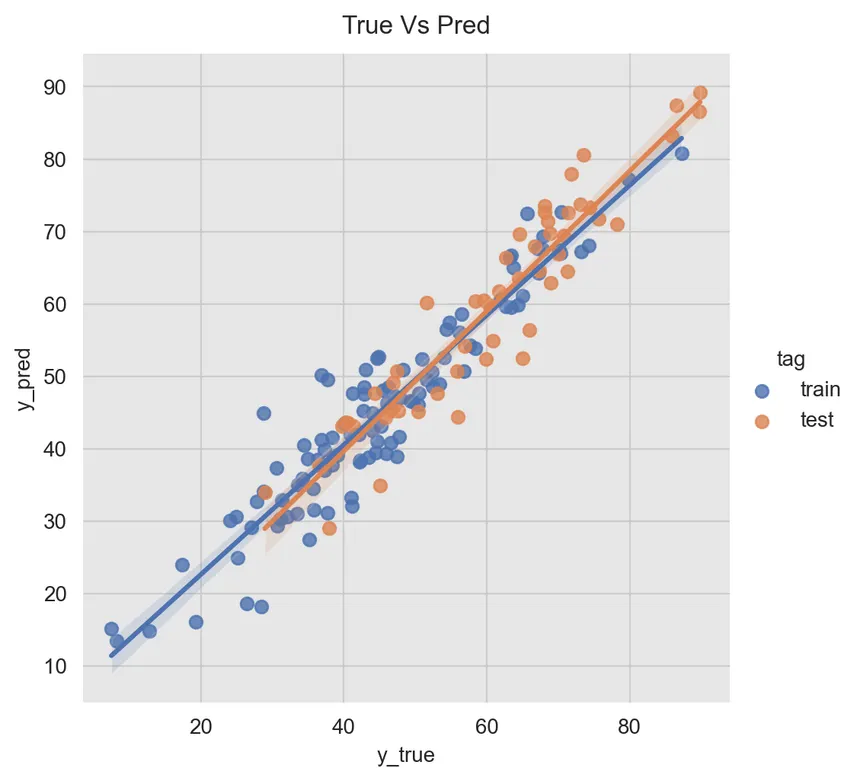
Linear regression finds the best straight line through a scatter of points. One value (like hours studied) predicts another (like test score). It’s like drawing a trend line on a scatterplot and using it to guess future data.
Classroom Story: When I first showed this to my juniors, I asked them to track daily screen time against quiz scores. They saw right away how more screen time often tied to lower scores, data you can actually test.
Why You’ll Use It
Simple but useful: This is the easiest predictive tool, yet it underlies more advanced stats methods.
Everywhere you look: From sports stats to business forecasts, you’ll find straight-line predictions.
Foundation for more: Once you get this, you’ll breeze through more complex models later.
The Line Equation
Every straight line follows:
y=a+b xy = a + b\,x
aa is where the line hits the yy-axis (intercept).
bb is how steep the line is (slope).
Symbol | What it means | Example in class |
xx | Input variable | Hours spent on homework |
yy | Output variable | Score on the next quiz |
aa | Starting point when x=0x=0 | Score if you don’t study at all |
bb | Change in yy per unit of xx | Points gained per extra study hour |
How to Work It Out Step-by-Step
Let’s use a small data set of study hours and quiz scores, just like in class. We’ll follow this handy guide to doing it by hand to see each move.
Find the averages.xˉ\bar{x} = average hours studiedyˉ\bar{y} = average quiz score
Calculate the slope bb.
b=∑(x−xˉ)(y−yˉ)∑(x−xˉ)2b = \frac{\sum (x - \bar{x})(y - \bar{y})}{\sum (x - \bar{x})^2}
Tip: Plot your points in Desmos first to make sure they roughly line up.
Find the intercept aa.
a=yˉ−b xˉa = \bar{y} - b\,\bar{x}
Write your prediction line. For example, if a=42a = 42 and b=6b = 6:
Predicted Score=42+6×(Study Hours)\text{Predicted Score} = 42 + 6\times(\text{Study Hours})
Quick check: An intercept of 42 means someone who didn’t study at all might still score around 42... good to know!
Where You’ll See It
In School
Study time vs. grades: I’ve had juniors boost their scores by tracking practice hours.
SAT scores vs. college GPA: Counselors use regression to help students plan.
In Business
Ads vs. sales: Companies use this to decide ad budgets—see this real example.
Experience vs. pay: You can predict salary bumps based on years at a job.
In Health
Exercise vs. fitness: Track gym time against a fitness test score.
Medicine dose vs. effect: Doctors estimate the right dose for patients.
What to Watch Out For
Regression only works if certain rules hold. I always remind students to check these before trusting their line.
Rule | What it means |
Straight-line link | The scatter should look roughly like a line |
Independent data | One point shouldn’t affect another |
Even spread of errors | Points should scatter evenly above and below the line |
For more detail, see this assumptions checklist.
Common Slip-ups
Mixing up cause and effect. Just because two things move together doesn’t mean one causes the other. My students loved the summer example: ice cream sales and sunburns both rise in summer but aren’t directly linked.
Letting outliers take over. A single odd data point can skew your results. Always plot first.
Forcing a line on curved data. If points bend, try a different method.
Reading Your Results
Slope sign: Positive means yy rises as xx rises; negative means it falls.
Correlation rr: Shows how tight the link is, from −1-1 (perfect down) to +1+1 (perfect up).
R2R^2 score: The share of yy changes explained by xx. An R2R^2 of 0.7 means 70% of score changes tie back to study time.
I once had a student worry a 0.5 R2R^2 was “too low.” I told them that in social data, 50% is often a solid link.
Tips to Master Regression

Do one example by hand. It sticks better than entering numbers into software.
Check your rules. Before trusting your line, revisit the table above.
Use tools wisely. After you know the steps, try Excel or Python for bigger data sets.
Compare predictions. Look at how your guesses match real values and ask why they differ.
A Simple Classroom Project
Last spring, I had teams track plant growth vs. time in sunlight. They:
Drew scatterplots.
Calculated aa and bb by hand.
Checked results in Excel.
Talked about odd data points, like a plant that barely grew.
Seeing math explain a real plant’s growth helped them see regression as a tool, not just a formula.
Wrap-Up and Next Steps
Linear regression turns data into clear predictions. You’ve learned to:
Know the equation y=a+b xy = a + b\,x
Work through each calculation
Spot when it does—or doesn’t—apply
Read slopes, rr, and R2R^2 like a pro

Try it yourself: Track something maybe sleep hours vs. mood rating for a week. Run your own regression and share what you find with your friends or online. Once you feel confident, jump into multiple regression or explore simple machine-learning tools.
Happy experimenting and remember, every great data story starts with a straight line!
Let me know if you’d like any part tightened up or if you want to add a quick table or example script!


Comments